Disclaimer: This passage contains notes and insights gathered from the internet. The content is used for educational purposes and attributed to the original authors. I do not claim any ownership over the material.
Debugging with GDB
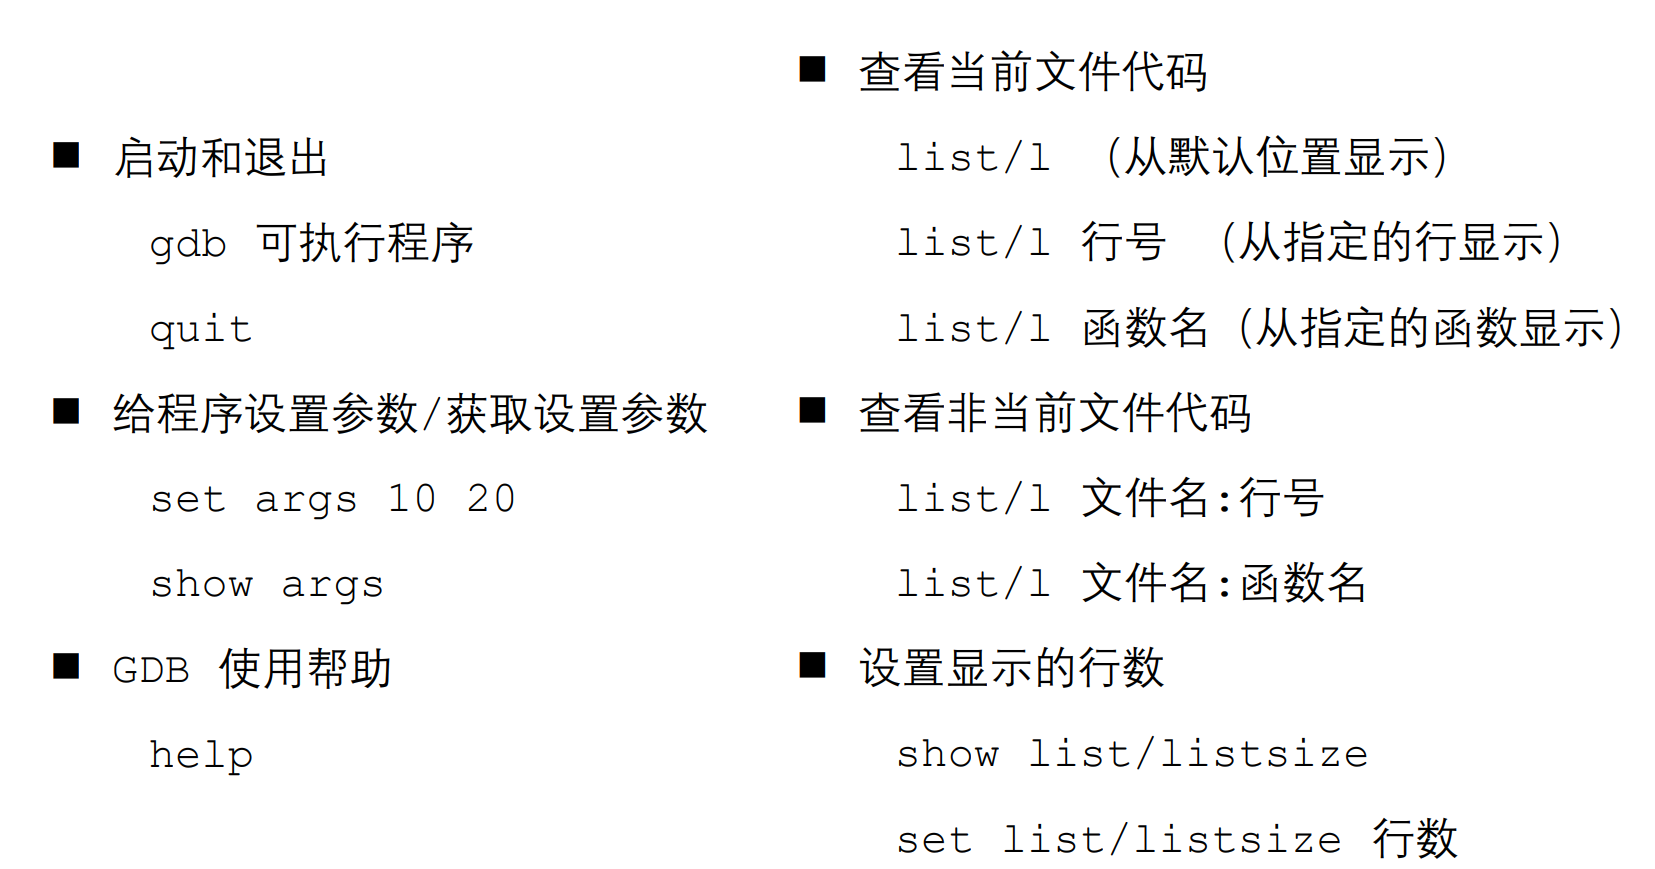
GDB Start
When debugging a program, it helps to compile it with the -g option, which adds extra debugging information to the binary executable file. This extra information helps the debugger find program variables and functions in the binary executable and enables it to map machine code instructions to lines of C source code (the form of the program that the C programmer understands). Also, when compiling for debugging, avoid compiler optimizations (for example, do not build with -O2). Compiler-optimized code is often very difficult to debug because sequences of optimized machine code often do not clearly map back to C source code. Although we cover the use of the -g flag in the following sections, some users may get better results with the -g3 flag, which can reveal extra debugging information.
Sometimes, when a program terminates with an error, the operating system dumps a core file containing information about the state of the program when it crashed.
$ gdb core a.out (gdb) where# the where command shows point of crash
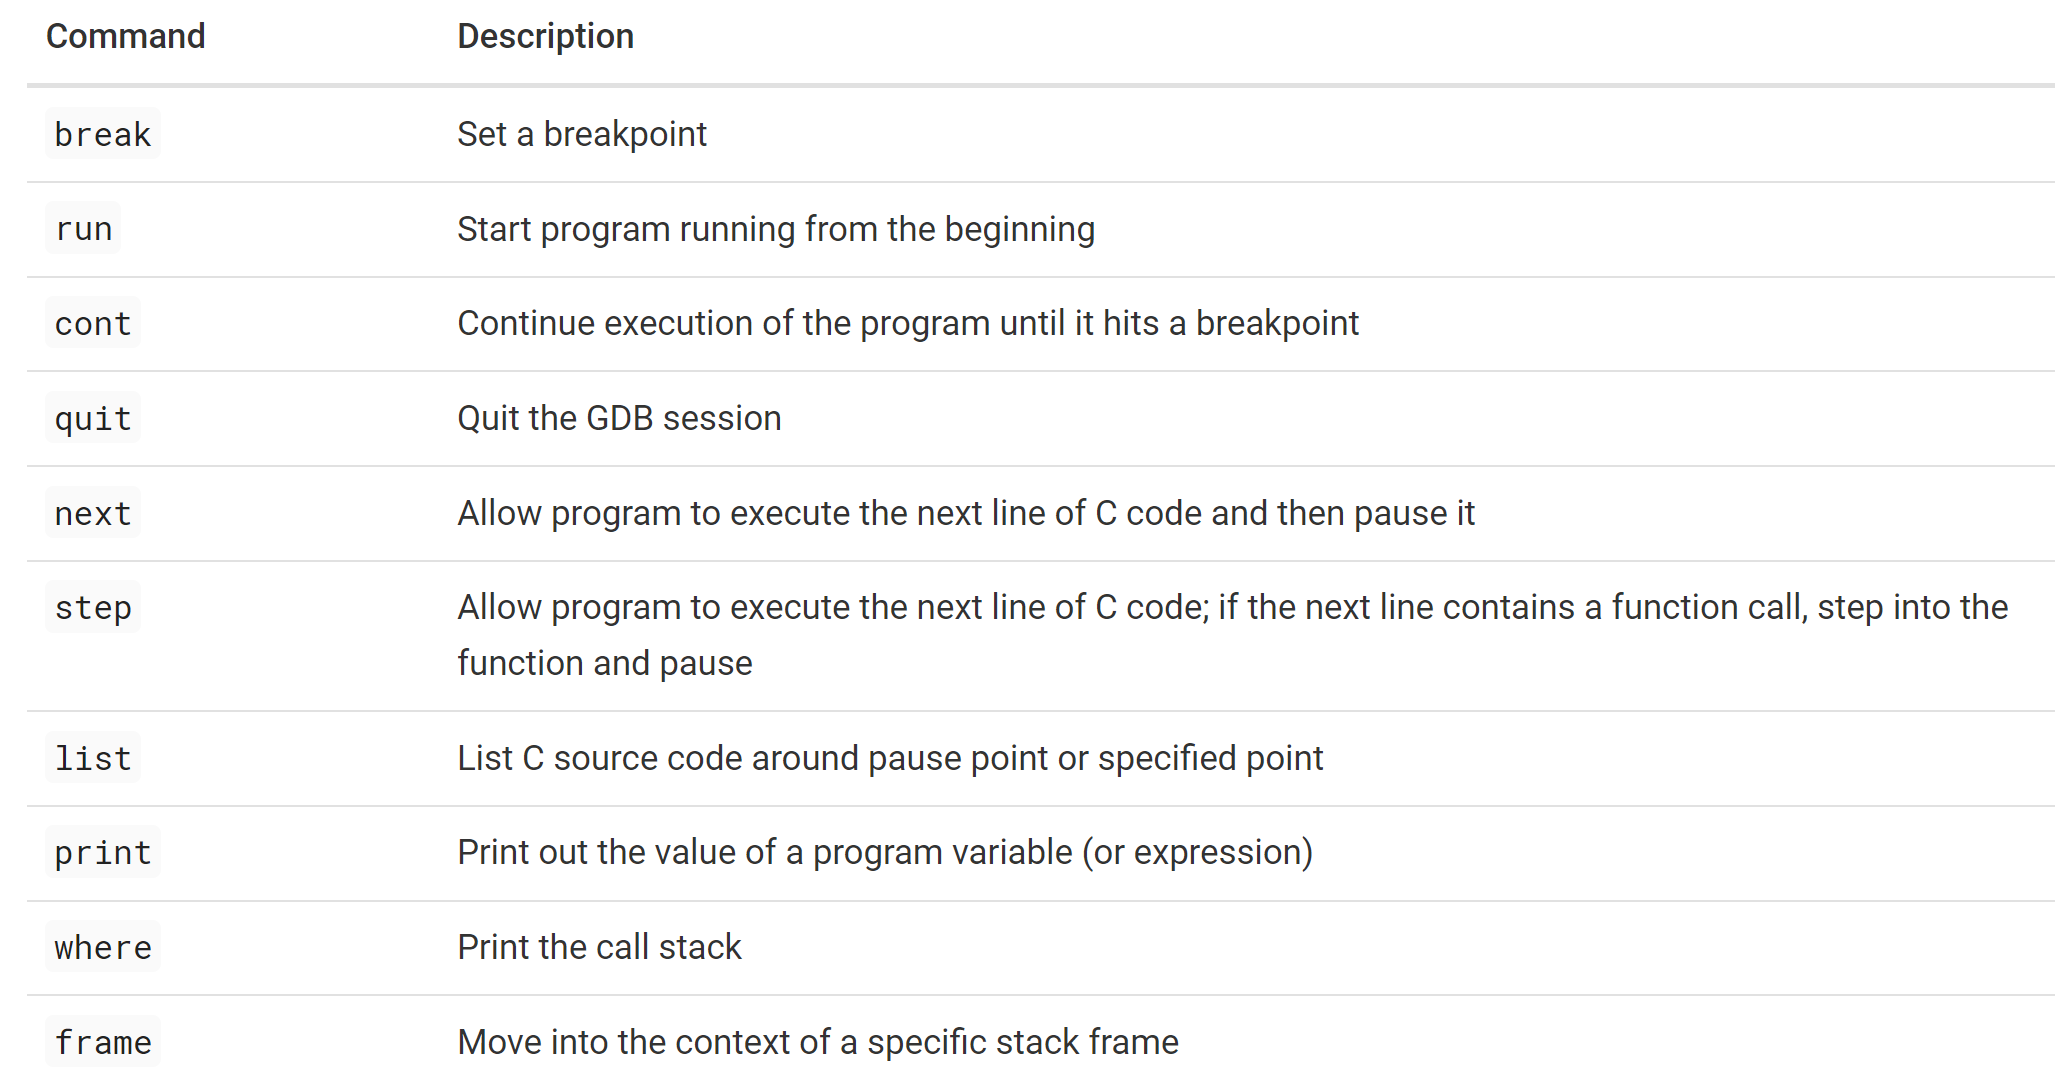
GDB Commands
The display command asks GDB to automatically print out the same set of program variables every time a breakpoint is hit.
(gdb) display i
1: i = 1
(gdb) display max
2: max = 17
(gdb) display array1[i]
3: array1[i] = 21

(gdb) cont
Continuing.

Breakpoint 2, findAndReturnMax (array1=0x7fffffffe290, len=5, max=21)
    at badprog.c:27
27          max = array1[i];
1: i = 2
2: max = 21
3: array1[i] = 44
...
...
The where (or bt, for “backtrace”, or backtrace) GDB command prints the current state of the stack.
(gdb) where
#0  findAndReturnMax (array1=0x7fffffffe290, len=5, max=17) at badprog.c:21
#1  0x0000555555554810 in main (argc=1, argv=0x7fffffffe398) at badprog.c:40
GDB’s frame command moves into the context of any frame on the stack. Within each stack frame context, a user can examine the local variables and parameters in that frame. In this example, we move into stack** frame 1** (the caller’s context) and print out the values of the arguments that the main() function passes to findAndReturnMax() (for example, arr and max):
(gdb) frame 1
#1  0x0000555555554810 in main (argc=1, argv=0x7fffffffe398) at badprog.c:40
40      if ( findAndReturnMax(arr, 5, max) != 0 ) {

(gdb) print arr
$1 = {17, 21, 44, 2, 60}

(gdb) print max
$2 = 17
ptype it will print out the type of a variable.
(gdb) ptype i
type = int
(gdb) ptype string
type = char *
(gdb) ptype &i
type = int *
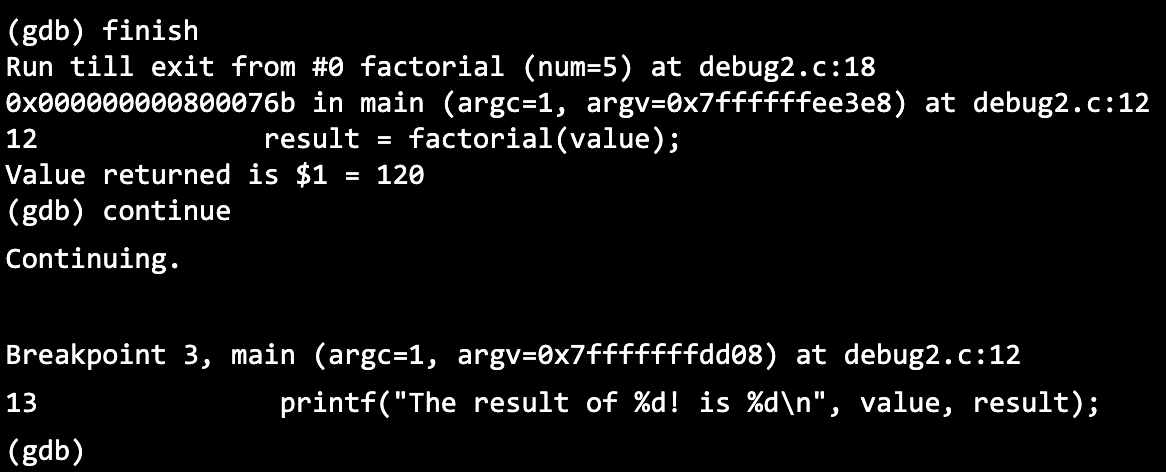
finish the command will be used in the function, then return to the caller and stop.
GDB Commands in Detail
Commands
help Help documentation for topics and GDB commands.
help <topic or command> Shows help available for topic or command
help breakpoints Shows help information about breakpoints helpprint Shows help information about printcommand
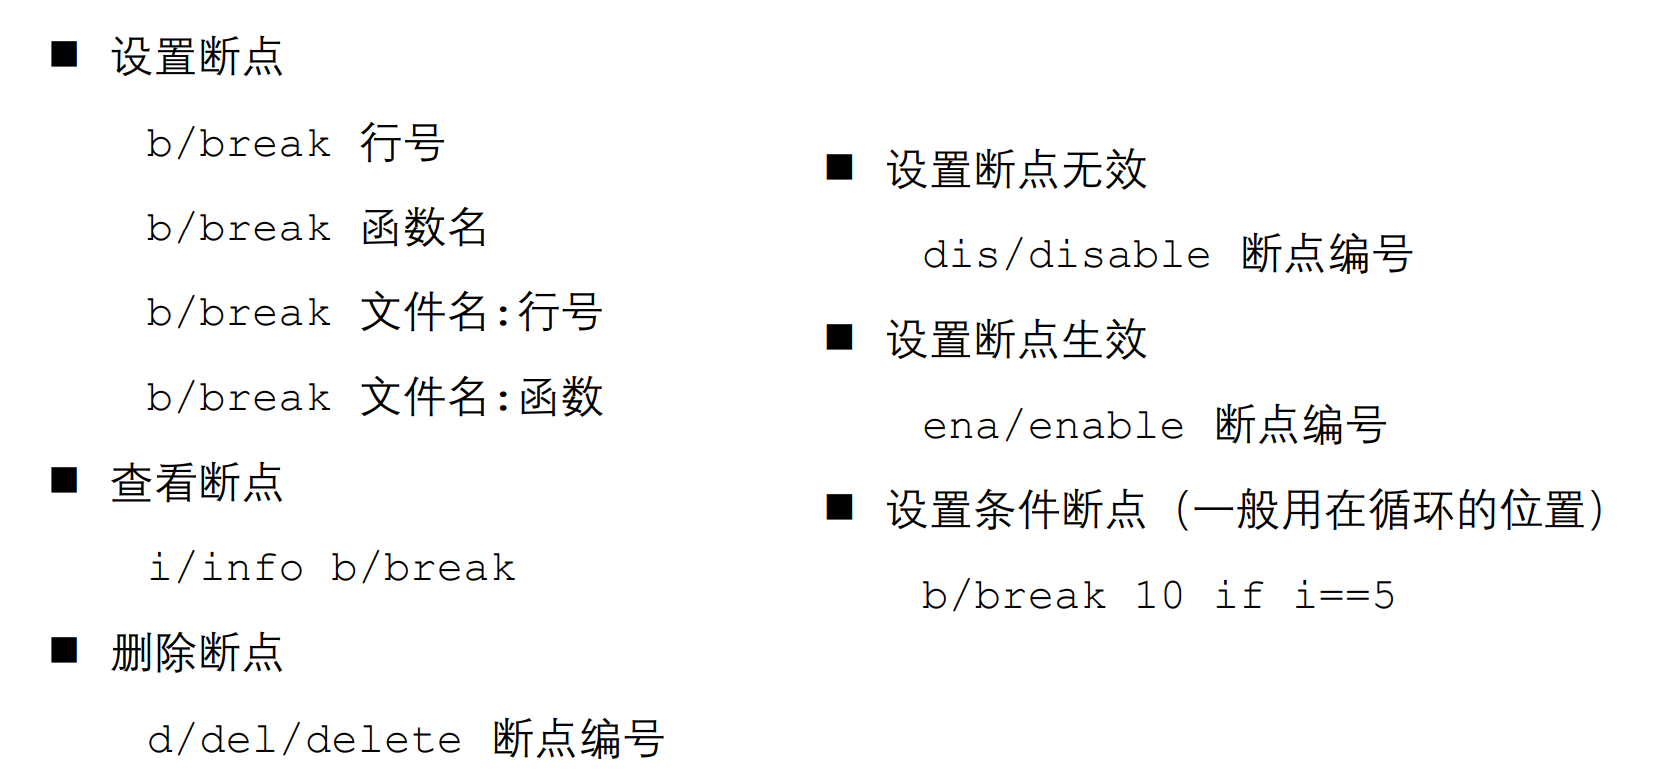
break Set a breakpoint.
break <func-name> Set breakpointatstartoffunction <func-name> break <line> Set breakpointatlinenumber <line> break <filename:><line> Set breakpointat <line> infile <filename>
break main Set breakpointat beginning of main break 13 Set breakpointatline13 break gofish.c:34 Set breakpointatline34in gofish.c break main.c:34 Set breakpointatline34in main.c
run Start running the debugged program from the beginning.
run <command line arguments>
runRun with no command line arguments run 2 40 100 Run with 3 command line arguments: 2, 40, 100
continue (cont) Continue execution from breakpoint
step (s) Execute the next line(s) of the program’s C source code, stepping into a function if a function call is executed on the line(s).
step Execute next line (stepping into a function) step <count> Executes next <count> lines of program code
step10 Executes the next10 lines (stepping into functions)
If a line contains a function call, lines of the called function are counted in the count total of lines to step through
next (n) Similar to the step command, but it treats a function call as a single line.
next Execute the nextline next<count> Executes next<count> instructions
until Execute the program until it reaches the specified source code line number.
quit Exit GDB
list or l List program source code.
list Lists next few lines of program source code list<line> Lists lines around linenumber<line> of program list<start><end> Lists line numbers <start> through <end> list<func-name> Lists lines around beginning of function<func-name>
list30100 List source code lines 30to100
where (backtrace, bt) Show the contents of the stack (the sequence of function calls at the current point in the program’s execution).
frame <frame-num> Move into the context of stack frame number . As a default, the program is paused in the context of frame 0, the frame at the** top** of the stack.
frame <frame-num> Sets current stack frame to<frame-num> info frame Show state about current stack frame
frame 3 Move into stack frame 3's context (0 is top frame)
Breakpoints
enable, disable, ignore, delete, clear Enable, disable, ignore for some number of times, or delete one or more breakpoints.
disable <bnums ...> Disable one or more breakpoints enable <bnums ...> Enable one or more breakpoints ignore <bpnum> <num> Don't pause at breakpoint <bpnum> the next <num> times it's hit delete <bpnum> Delete breakpoint number <bpnum> delete Deletes all breakpoints clear <line> Delete breakpoint at line <line> clear <func-name> Delete breakpoint at function <func-name>
info break List breakpoint info (including breakpoint bnums) disable 3Disable breakpoint number 3 ignore 25 Ignore the next 5 times breakpoint 2 is hit enable 3 Enable breakpoint number 3 delete 1 Delete breakpoint number 1 clear 124 Delete breakpoint at source code line 124
condition Set conditions on breakpoints.
condition <bpnum> <exp> Sets breakpoint number <bpnum> to break only when expression <exp> is true
break 28 Set breakpoint at line 28 (in function play) info break Lists information about all breakpoints Num Type Disp Enb Address What 1breakpoint keep y 0x080483a3 in play at gofish.c:28
condition 1 (i > 1000) Set condition on breakpoint 1
Print
print (p) Display the value of an expression.
print<exp> Display the value of expression <exp>
p i print the value of i p i+3print the value of (i+3)
// different formats print<exp>Print value of the expression as unsigned int print/x<exp>Print value of the expression in hexadecimal print/t <exp>Print value of the expression in binary print/d <exp>Print value of the expression as signed int print/c<exp>Print ASCII value of the expression print (int)<exp>Print value of the expression as unsigned int
print/x123 Prints 0x7b print/t 123Print1111011 print/d 0x1c Prints 28 print/c99 Prints 'c' print (int)'c' Prints 99
// pointer print *(int *)0x8ff4bc10 Printint value at address 0x8ff4bc10 print *ptrPrint the int value pointed to by ptr
// hardware print $eax Print the value stored in the eax register
x (examine memory) Display the contents of a memory location. This command is similar to print, but it interprets its argument as an address value that it dereferences to print the value stored at the address.
x <memory address expression>
x0x5678 Examine the contents of memory location 0x5678 xptr Examine the contents of memory that ptr points to x &temp Can specify the address of a variable (this commandis equivalent to: print temp)
In general, x takes up to three formatting arguments (x/nfu <memory address>)
n: the repeat count (a positive integer value)
f: the display format (s: string, i: instruction, x: hex, d: decimal, t: binary, a: address, …)
u: the units format (number of bytes) (b: byte, h: 2 bytes, w: 4 bytes, g: 8 bytes)
x/d ptrPrint value stored at what ptr points to, in decimal x/a &ptrPrint value stored at address of ptr, asan address x/wx &temp Print4-byte value at address of temp, in hexadecimal x/10dh 0x1234 Print10 short values starting at address 0x1234, in decimal
x/4c s1 Examine the first4 chars in s1 0x40062d 72'H'101'e'108'l'108'l'
x/s s1 Examine memory location associated with var s1 asastring 0x40062d "Hello There"
x/wd s1 Examine the memory location assoc with var s1 asanint (because formatting is sticky, need to explicitly set units to word (w) after x/s command sets units to byte) 0x40062d 72
x/8d s1 Examine ASCII values of the first8 chars of s1 0x40062d: 721011081081113284104
whatis show the type of an expression.
whatis <exp> Display the datatype of an expression
whatis (x + 3.4) Displays: type = double
set assign/change the value of a program variable, or assign a value to be stored at a specific memory address, or in a specific machine register.
set <variable> = <exp> Sets variable <variable> to expression <exp>
set x = 123 * y Setvar x's value to (123 * y)
info lists information about program state and debugger state.
help info Shows all the info options help status Lists more infoand show commands
info locals Shows local variables in current stack frame info args Shows the argument variable of current stack frame info break Shows breakpoints info frame Shows information about the current stack frame info registers Shows register values info breakpoints Shows the status of all breakpoints
Valgrind
Run Valgrind
Valgrind runs the Memcheck tool by default; we depend on this default behavior in the code snippets that follow.
You can explicitly specify the Memcheck tool by using the --tool=memcheck option. In later sections, we will invoke other Valgrind profiling tools by invoking the --tool option.
To view details of individual memory leaks, use the --leak-check=yes option.
# view program and valgrind output saved to out file $ vim output.txt
Parse Valgrind
==31059== Invalid write of size 1
==31059==    at 0x4006C5: foo (valgrindbadprog.c:29)
==31059==    by 0x40079A: main (valgrindbadprog.c:56)
==31059==  Address 0x52045c5 is 0 bytes after a block of size 5 alloc'd
==31059==    at 0x4C2DB8F: malloc (in /usr/lib/valgrind/...)
==31059==    by 0x400660: foo (valgrindbadprog.c:18)
==31059==    by 0x40079A: main (valgrindbadprog.c:56)
==31059==: Each line of Valgrind output is prefixed with the process’s ID (PID) number (31059 in this example)
Valgrind errors and warnings Format:
The type of error or warning.
Where the error occurred (a stack trace at the point in the program’s execution when the error occurs.)
Where heap memory around the error was allocated (usually the memory allocation related to the error.)
==31059== Invalid write of size 1: In the preceding example error, the first line indicates an invalid write to memory (writing to unallocated memory in the heap — a very bad error!)
==31059== Invalid write of size 1
==31059==    at 0x4006C5: foo (valgrindbadprog.c:29)
==31059==    by 0x40079A: main (valgrindbadprog.c:56)
The next few lines show the stack trace where the error occurred. These indicate an invalid write occurred at line 29 in function foo(), which was called from function main() at line 56
==31059==  Address 0x52045c5 is 0 bytes after a block of size 5 alloc'd
==31059==    at 0x4C2DB8F: malloc (in /usr/lib/valgrind/...)
==31059==    by 0x400660: foo (valgrindbadprog.c:18)
==31059==    by 0x40079A: main (valgrindbadprog.c:56)
The remaining lines indicate where the heap space near the invalid write was allocated in the program. This section of Valgrind’s output says that the invalid write was immediately after (0 bytes after) a block of 5 bytes of heap memory space that was allocated by a call to malloc() at line 18 in function foo(), called by main() at line 56.
The information from this error identifies that there is an unallocated heap memory write error in the program, and it directs the user to specific parts of the program where the error occurs (line 29) and where memory around the error was allocated(line 18).
18 c = (char *)malloc(sizeof(char) * 5); ... 22strcpy(c, "cccc"); ... 28for (i = 0; i <= 5; i++) { 29 c[i] = str[i]; 30 }
Advanced GDB Features
GDB and make
GDB accepts the make command to rebuild an executable during a debugging session, and if the build is successful it will run the newly built program (when issued the run command).
(gdb) make
(gdb) run
a GDB user can run make and start debugging the new version of the program with all the breakpoints still set. REBUILD
However, that modifying the C source and recompiling by running make from within GDB may result in the breakpointsnot being at the same logical location in the new version of the program as in the old version if source code lines have been added or deleted.